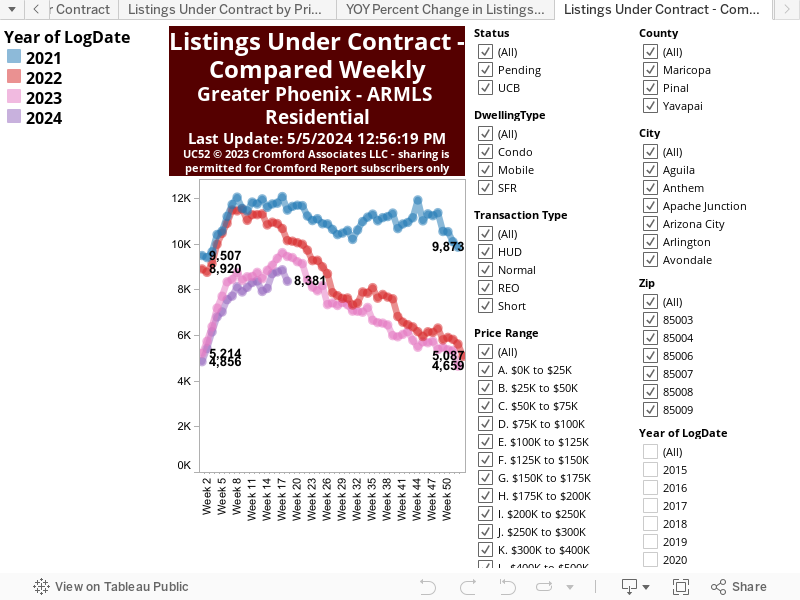
The chart above plots the number of listings under contract, measured on a weekly basis. Under contract means the listing is either in pending or AWC status. You can select either or both of these using the check boxes on the right.
This is a useful tool for measuing demand and for which sectors it is strongest or weakest.
You can select which dwelling types (single family, condo, mobile) should be included. You can also filter by county, city and Zip code, to choose the exact geographic area you wish to study.
You may also choose from normal, REO, short and/or HUD listings, or any combination of these.
You may also limit your chart to one or more price ranges.
Copyright for this chart is strictly reserved. If you are an active subscriber to the Cromford Report, you may share this chart with your client or link to it on your blog or web-site. It is NOT permitted for non-subscribers to share it with anyone in any medium.
Subject to the above restrictions, you can download the chart as an image or create a PDF. Alternatively you can use the "Share" button to create an extract to email or a link to embed in your site.